D2 is a text-first diagramming language that transforms simple scripts into clear diagrams. It is designed to simplify the creation of complex diagrams by converting straightforward scripts into visually clear and professional representations. D2 offers an alternative to cumbersome graphical editors.
This guide serves as a comprehensive introduction, providing everything a beginner needs to know. It covers the core concepts of D2 and helps you choose the best starting point, whether for quick experimentation in the online playground or for local development using the command-line tool.
What is D2, and why use it?
D2 is a declarative diagramming language that turns plain text into flowcharts, architecture diagrams, and other structured visuals. It is ideal when you want source-controlled, reproducible diagrams that are easy to edit and generate programmatically.
- Readable source – diagrams are plain text, making them diffable and easy to maintain.
- Fast iteration – edit the text and recompile; no drag-and-drop manual layout required.
- Multiple output options – export to SVG or PNG for documentation and presentations.
D2 solves the common problem of outdated diagrams by treating them as code. This allows marketing teams to version, review, and regenerate visuals alongside evolving systems, unlike static sketches or drag-and-drop diagrams. D2 makes communicating designs, aligning teams, and explaining complex systems easier by ensuring diagrams accurately reflect reality.
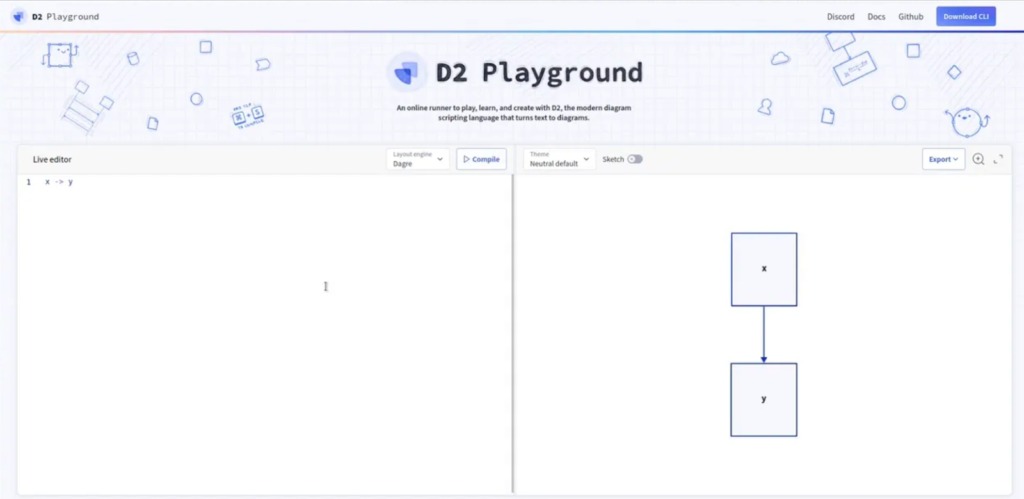
Try D2 quickly: Playground vs local install
Two fast ways to start:
- Online playground – instant, browser-based editor and preview for testing and learning.
- Local install – install platform binaries or use package manager releases to render diagrams locally or integrate into CI.
Use the playground for learning and drafts, then switch to a local binary for automation and production exports.
Core concepts: nodes, links, labels
D2 diagrams are built from a few simple elements:
- Node – any word or phrase becomes a node in the diagram.
- Link – connect nodes with operators to show relationships.
- Label – short identifiers that let you reuse nodes without typing long names repeatedly.
Basic connections
The most common linking operators are a directed arrow and an undirected line. You can use these to express flows and relationships.

In this example:
-
TV points to the remote with the label “controlled with”.
Using labels to avoid long names
Labels are short tokens that stand for nodes. Define a label once and reuse it across connections so the diagram stays tidy.

Using labels prevents duplication when the same node appears in many connections. If you mix full text and labels for the same entity, the renderer may treat them as separate nodes. Be consistent.
Shapes and visual styles
D2 supports a library of shapes and visual primitives for denoting different types of elements (clouds, pages, people, databases, code blocks, etc.). Assigning shapes helps readers scan diagrams faster.
The exact syntax for applying shapes varies; consult the official shape list when you need a particular icon or style.
Connection labels, comments, and formatting tricks
Edge labels
Most diagram languages let you attach text to an edge so a relationship is described inline. Place short descriptive text on the same line as the connection to annotate it.

Comments
Use a comment marker to temporarily disable lines or to leave notes in the source. Commented lines are ignored by the renderer.

Line continuation for long labels
Long node names or labels can wrap the layout. Many editors and the D2 text format allow a line continuation sequence so you can split long strings across lines for readability.
 Common mistakes and how to avoid them
- Inconsistent labels – define and reuse labels rather than mixing full names and tokens. Mixing creates duplicate nodes.
- Overly long labels – split long names with continuation or use short labels with a descriptive legend.
- Unnecessary repetition – avoid repeating identical links unless you mean to emphasize or create multiple parallel edges.
- Not using comments – comment out draft lines instead of deleting them so you can revert quickly.
- Relying on manual layout – allow the renderer to handle layout unless you need explicit control; manual positioning defeats the point of declarative diagrams.
Checklist: Produce maintainable D2 diagrams
- Choose the playground for quick edits or install locally for automation.
- Use short labels for frequently referenced nodes.
- Add edge labels for important relationships only.
- Keep shapes consistent to communicate meaning (cloud, database, person, etc.).
- Comment out experimental lines instead of deleting them.
- Store diagram text in version control with other project docs.
Here’s the D2 code and a diagram created for the above checklist:
 Where to learn more and reference material
For full syntax, shape lists, and advanced layout options, refer to the official D2 documentation and examples. The documentation contains the complete shape catalog, advanced layout directives, and integration guides for CI pipelines.
Conclusion
D2 makes it easy to create reproducible diagrams by writing plain text instead of relying on manual drawing tools. By starting in the playground, learning the basic node and link syntax, and adopting simple practices like label reuse and comments, you can produce diagrams that are easy to read and easy to change. Using consistent shapes and concise edge labels helps communicate structure and intent without clutter.
More importantly, D2 fits naturally into modern engineering workflows. Diagrams can live alongside code, be reviewed through pull requests, and be regenerated whenever systems change. This keeps documentation accurate over time and makes diagrams a reliable tool for design discussions, onboarding, and decision-making, rather than static artifacts that quickly become outdated.
To learn more about D2, visit the D2 documentation page.